The Fitness Challenge Handbook
Designing The Challenge
Verifying fitness challenge data through statistical analysis
Statistical Data Analysis
Both admin recorded data and the honor system have the same flaw: invalid data points. Simply adding or removing one digit of a participant’s data can drastically affect the outcome of the challenge. Therefore, a system of validation should be put in place to check the reasonableness of every entry. The simplest and most effective method for performing this is to use standard deviation.
Standard deviation is used to determine confidence that a particular data point falls within an ordinary range. By using two
standard deviations, you can assume 95% confidence that the value in question is valid if it falls within the given range.
The first step in finding the standard deviation is finding the mean. To determine the mean, add all of the data points and
then divide by the number of data points.
E.g. for a given set of steps walked in a day (1000, 3000, 4000, 5000, 5000, 11000), the mean is:
Mean = (1000 + 3000 + 4000 + 5000 + 5000 + 11000) / 6 = 4833
Next, compute the variance by subtracting each data point by the mean, squaring it and then determining the average.
Variance = ((1000 – 4833)2 + (3000 – 4833)2 + (4000 - 4833)2 + (5000 - 4833)2 + (5000 - 4833)2 + (11000 - 4833)2) / 6
= (14691889 + 3359889 +693889 + 27889 + 27889 + 38031889) / 6
= 9472222
= (14691889 + 3359889 +693889 + 27889 + 27889 + 38031889) / 6
= 9472222
Finally, to compute the standard deviation, take the square root of the variance:
Standard Deviation = √9472222 = 3078
Now that you have the standard deviation, you can use it to determine confidence by computing the upper and lower bounds for
your range of numbers. This is accomplished by subtracting the standard deviation from the mean for the lower bound and adding
the standard deviation to the mean for the upper bound. For example:
Lower Bound = 4833 – 3078 = 1755
Upper Bound = 4833 + 3078 = 7911
Upper Bound = 4833 + 3078 = 7911
In a normal distribution, 68% of all values will fall within one standard deviation. In our example, both the 1000 data point
and 11000 data point would fall outside of one standard deviation. If we are checking on every outlier that is reported in our
fitness challenge and 32% are considered outliers, we are in for a lot of work. Instead, we should try two standard deviations
which will give us 95% confidence that our data is valid. To calculate the upper and lower bounds with two standard deviations,
simply multiply the standard deviation by two:
Lower Bound = 4833 – 6155 = -1322
Upper Bound = 4833 + 6155 = 10988
Upper Bound = 4833 + 6155 = 10988
Now, only the 11000 data point barely falls outside of the standard deviation and should be checked out. If you are considering
thousands of data points, you may even want to consider using three standard deviations which would raise confidence to over 99%.
Doing this by hand would require considerable work. Fortunately, spreadsheets can accomplish this with much less effort.
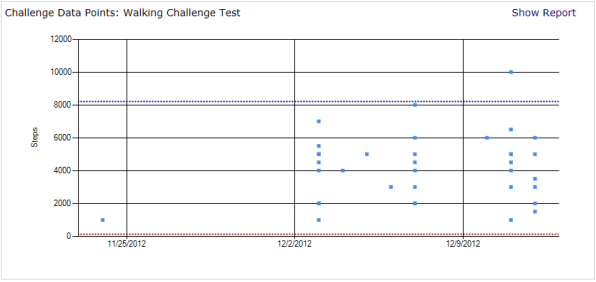
Challenge management systems should also provide this analysis automatically. A sample report from ChallengeRunner.com appears
as follows