Admin How-To Guide
Creating and running a date-based, standard challenge
Using the ChallengeRunner platform to create a standard date-based challenge.
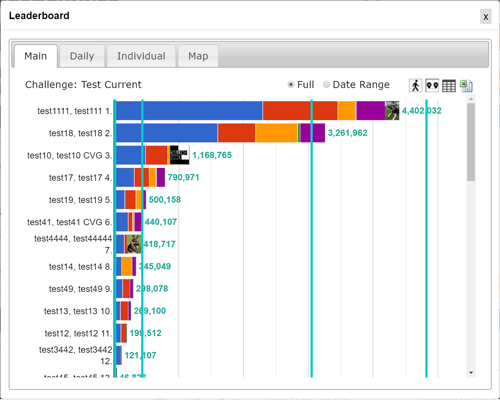
A typical fitness challenge consists of one-or-more activities with distinct start and end dates. The individual or team who accumulates the most activity points by performing these
activities wins the challenge. The leaderboard for a date-based challenge is most often a horizontal bar-chart with the leader at the top but can also be a regional or global
map with the leader closest to the designated finish line.
Date-Based Challenge Overview
As with all challenges except Virtual Racing, the challenge admin must decide on the activity or activities in the challenge such as steps walked, active minutes, sleep etc., how they want the
leaderboard displayed (with all participants, using anonymous ids, or just the individual), and the start and end date for each activity which can be staggered or run in parallel.
The challenge starts at midnight (local time of each user) on the start date of the initial activity. Participants enter data for activities using the website, smartphone apps, or fitness trackers
(if enabled) while the leaderboard updates in real-time. The challenge ends at midnight (local time) on the selected end date of the final activity.
The winner can be declared after the challenge ends but you may allow additional days to enter old data if desired.
Leaderboards
The leaderboard of a date-based challenge comes in two flavors: horizontal bar chart and race map. The horizontal bar chart displays the participants' total points with the point leader
at the top of the chart with others following below. With a race map, the admin must set the start and finish locations as well as any desired waypoints along the way. Based on point
totals, participant markers are moved from the starting line across the map until they reach the finish line. Both leaderboard types are updated in real-time as participants enter data.
When teams are used, their data can either be averaged or totaled. When teams are of varying sizes, it is best to use averaging to allow smaller teams to compete with larger teams.
If a challenge has some participants in teams and others as individuals, the leaderboard will show both on the main leaderboard with an additional leaderboard available to show only
results as individuals. If a race map is used to display results, the bar chart is also available as a sub leaderboard.
<< Prev Next >>