Admin How-To Guide
Challenge Reporting
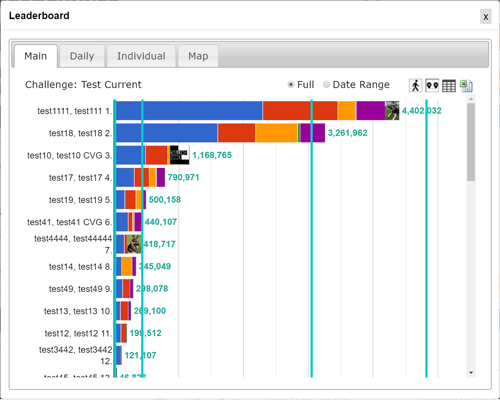
Leaderboards
By default, the challenge leaderboard displays on the admin page with the current standings for the top teams or participants with actual names. This is the case regardless of whether you chose to run an individual challenge or if you selected to use anonymous names. On the participant page, the user as well as the ten participants immediately above and below in leaderboard standings will be shown. If you click on the More (ellipsis) button in the Leaderboard panel, the Reporting dialog will appear. From here, you have the following additional options:
- All participants are shown on the leaderboard.
- If teams are being used, a tab will be available showing individual standings.
- Daily standings for the current date are available in a separate tab.
- If milestones are being used, a separate report is available to the admin showing the time and date every participant crossed a milestone.
- Select a date range: allows the admin to select from and to dates for the leaderboard which can be used to show daily or weekly winners.
- Run a participation report to display how often members are participating in the challenge.
- Display the leaderboard data as a sortable grid with actual numbers for each activity.
- Download the leaderboard or grid into a spreadsheet compatible CSV file.
For challenges with multiple activities, leaderboards are available for each to display activity leaders. Click the Activity Leaderboard button to view the leaderboard dialog. The Activity Leaderboard has the same options available as the Challenge Leaderboard (shown above). If you would like to make the Activity Leaderboard available to your challenge participants, click the Edit Activity button and then select option: Display leaderboard for this activity to participants.
Challenge Map
In addition to a traditional horizontal bar chart, the leaderboard can be shown as a challenge map. The map route starting and finishing line as well as any waypoints are chosen by the admin and displayed on a global map. In addition, the admin sets the number of points that correspond with a mile or kilometer. Participant position on the map is shown as a marker along the route based on the number of points the participant has earned. Just like any challenge in the system, points can be awarded for walking, hydration, meditation, or any other activity the admin chooses. For more information on creating a challenge map, please see: Enable Challenge Map
NOTES:- The mapping system uses actual roads and real distances to determine the route and plot user progress along the path.
Activity Data
Each activity will have an associated Activity Data button. When clicked, a dialog is displayed with all data points for each participant with dates and values. This report is very useful for verifying user data and can also be used to generate custom leaderboards when downloaded into a spreadsheet.
Users may also view participant data as a scatter chart which more clearly illustrates outlier data (data points that fall outside of two standard deviations). This is useful when determining data entry problems i.e. typing errors where entered value is too large or too small. To display the scatter chart, click the View Chart button.
The activity data dialog also has a unique feature that will allow admins to bulk upload participant data. This feature is useful for uploading large volumes of past or current participant data. If you choose to bulk upload data using a csv file, gather the participant email addresses including data point dates and values in a spreadsheet (a template file is provided) and click the Upload button. The file will be verified and, if everything checks out, the participant’s data will be included in your challenge when you click Finish.
NOTES:- Be VERY careful when bulk uploading data. Any data that already existed for that date will be overwritten. In addition, this process does not check restrictions such as upper and lower bound to validate that the data fits your challenge constraints. You must validate your data before loading it into the ChallengeRunner system.
Milestone Progress
Any challenge that uses milestones to track participant progress will have a Milestone Progress report available. This report lists all challenge participants (or teams) and displays the time and date when each participant crosses a given milestone. Each column is sortable in either ascending or descending order by clicking on the column header. The sorting feature is useful when determining who crossed a particular milestone first.
The Milestone Progress report is particularly helpful when creating an event-based challenge where the challenge winner is determined by when a participant crosses a certain milestone as opposed to who has the most points on a given date. When coupled with a Challenge Map, this report can be used to create an effective race where points can be awarded for any activity the challenge administrator chooses. For more information on setting up milestones, please see: Fitness Challenge Milestones
Awards
If your challenge is using milestones and awards, an Awards Report button is available on the Leaderboard panel. Once clicked, the Awards dialog appears detailing users who qualify for awards and the award they selected. See Setting Milestones and Awards above for more details.
Most Improved
All participants want to win the challenge; either because of the awards or simply for the achievement. However, in a larger challenge with participants of varying fitness levels, winning a fitness-related challenge may not be a realistic option for some. This is where the Most Improved report comes in.
Organizations generally do not run fitness-related challenges for the winners. The challenge winners are usually in good shape to begin with and will continue to be fit whether they are enrolled in a fitness challenge or not. Instead, fitness challenges are really intended for those who need a little incentive getting into better shape and developing healthy habits. The ChallengeRunner Most Improved report was developed for those participants and can be used to determine who has advanced the farthest from a sedentary lifestyle.
Because it would be pretty easy to hold back or "sandbag" to achieve Most Improved, the report does much more than simply look at the beginning and ending data to determine who has improved the most. When the Most Improved button is clicked by the challenge admin, the report runs a series of statistical analysis checks to parse through all of the available data and discards anomolies. Even so, it is generally a good idea to only announce that there will be a "Most Improved" award at the conclusion of the challenge and only include it in challenges where it makes sense.
NOTES:- The Most Improved report is only available to challenge admins.
- The Most Improved report can be run for the challenge as a whole or for the individual activities in a challenge. Because the challenge can encompass a wide variety of activities and some of those activties may not make sense in the context of most improved (e.g. awarding activity points for attending a wellness lunch-and-learn), it is recommended that the Most Improved report be used for individual activities within the challenge such as steps walked or active minutes.
Location Leaderboard
Challenge admins have the option to add locations or groups to their organization account (see Organization Settings - Additional Info). When enabled, this option provides an additional dropdown during registration for participants to select their location or group. This extra piece of information is included in several reports allowing more sorting and grouping options for admins. It also enables the Location Leaderboard report.
The Location Leaderboard report displays challenge data that is grouped by the location selected by participants during registration. This data is initially shown as a horizontal bar chart of average points but it can be toggled to show a report with both average and total points. The report can also be downloaded as a csv file for use in a spreadsheet. Alternatively, the bar chart image can be saved and shared with participants if desired.
NOTES:- The Location Leaderboard is only available to challenge admins.
- Participants that do not select a location will be grouped together as Unknown.